Get colors for your heatmap annotation
Published:
This post will show how to configure quickly the colors for the annotation of rows/columns that go on top or on the side of a heatmap.
Published:
This post will show how to configure quickly the colors for the annotation of rows/columns that go on top or on the side of a heatmap.
Published:
This post should show you an easy way to get the following data type integrated into a figure:
Published:
This is a funny story, and I will try to tell you how I realized I don’t know anything about R in 400 words.
Published:
Differentially gene expression analysis with RNA-seq data is quite common nowadays, and there are pretty good Bioconductor packages for that: limma::voom, DESeq2 …
Published:
In summary: I will show which is the best miRNA mapping tool. I used several options for this benchmarking:
Published:
My PhD was focused on small RNA sequencing data. I had a problem when I wanted to visualized the amount of small RNAs from the beginning. Here the problem, assume that you have a certain distribution of small RNA sequences abundance:
Published:
What is the lying factor in figures?
Published:
Everybody who is working with microRNA knows about miRBase, it was the first miRNA catalogue. Everybody is using it to annotate small RNA sequences as miRNA or not. And it is great, and very helpfully…but there are some cases that we should investigate our results.
Published:
I spent all my PhD working with small RNA sequences data. The main problem was, always those sequences that map in multiple locations, also denominated ambiguous sequences. From the very beginning, this made that pipelines remove this kind of sequences from the analysis, because you cannot assign them a unique location in the genome. But these sequences are interesting to study, since many of them change in size, for instance. This complexity is due to repeats in the genome and the scenario I am talking about here it is shown in the following figure: 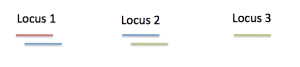
Published:
One of my interest in science is finding new ways to visualize Big Data. Scientist are used to work with static visualization, that of course, is wonderful in the majority of the case. But it wouldn’t be better dynamic visualization for exploration? Play with your data, explore, and finally when you get that great figure that tell you everything you was looking for, you can export it to an image portable format.
Published:
How much keywords in bioinformatics has changed in the past 7 years?
I did a small and quick experiment. I took the abstract of the papers published in Bioinformatics during Jan-2005 and during Jan-2012. Then I represented the words according to their frequency with the wordle tool. And the result was: