visualizing small RNA mapping complexity
I spent all my PhD working with small RNA sequences data. The main problem was, always those sequences that map in multiple locations, also denominated ambiguous sequences. From the very beginning, this made that pipelines remove this kind of sequences from the analysis, because you cannot assign them a unique location in the genome. But these sequences are interesting to study, since many of them change in size, for instance. This complexity is due to repeats in the genome and the scenario I am talking about here it is shown in the following figure: 
Each color it would be a different sRNA, and the lines show the locations of each sRNA. There are location shared by some of the sRNAs, and you can easily transform this into a network of vertexes and edges, where vertexes are locations and edges, are their relationship coming from the sRNAs inside them. In this case it would generate three circles connected between them. And that it was I did with a real data set. I used igraph in R to represent this with the help of this great tutorial. The result is:
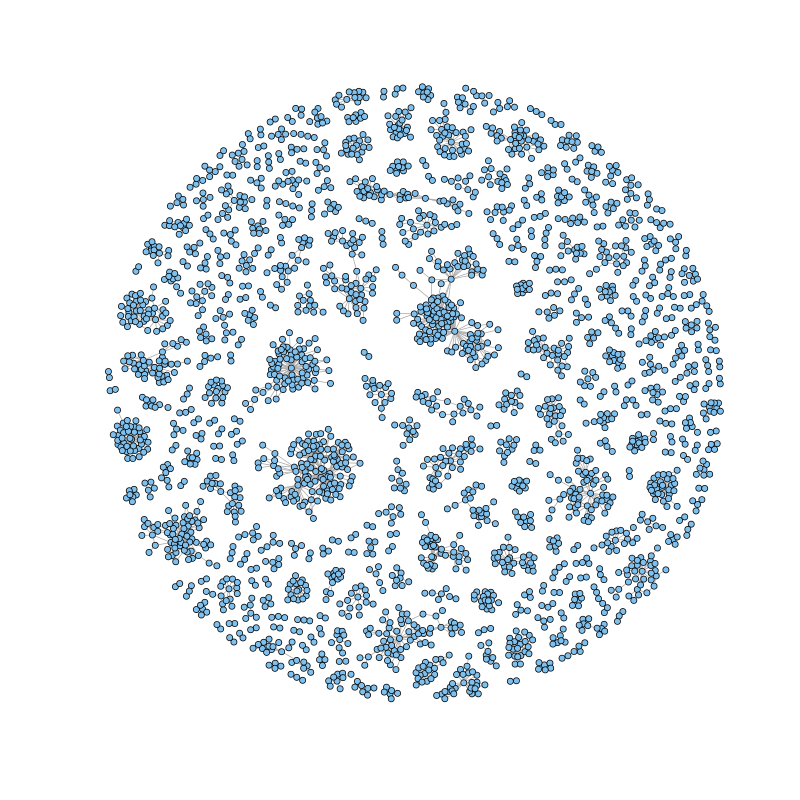
It is very easy to detect high complexity regions, where locations are connected because some sRNAs map to anywhere else. From here, you can add more information, as the average size of the sRNAs inside each location, or the expression (red: low, yellow:high).  In a quick view you can check the complexity of your small RNA data and the expression associated. The code is published at Rpub repository.