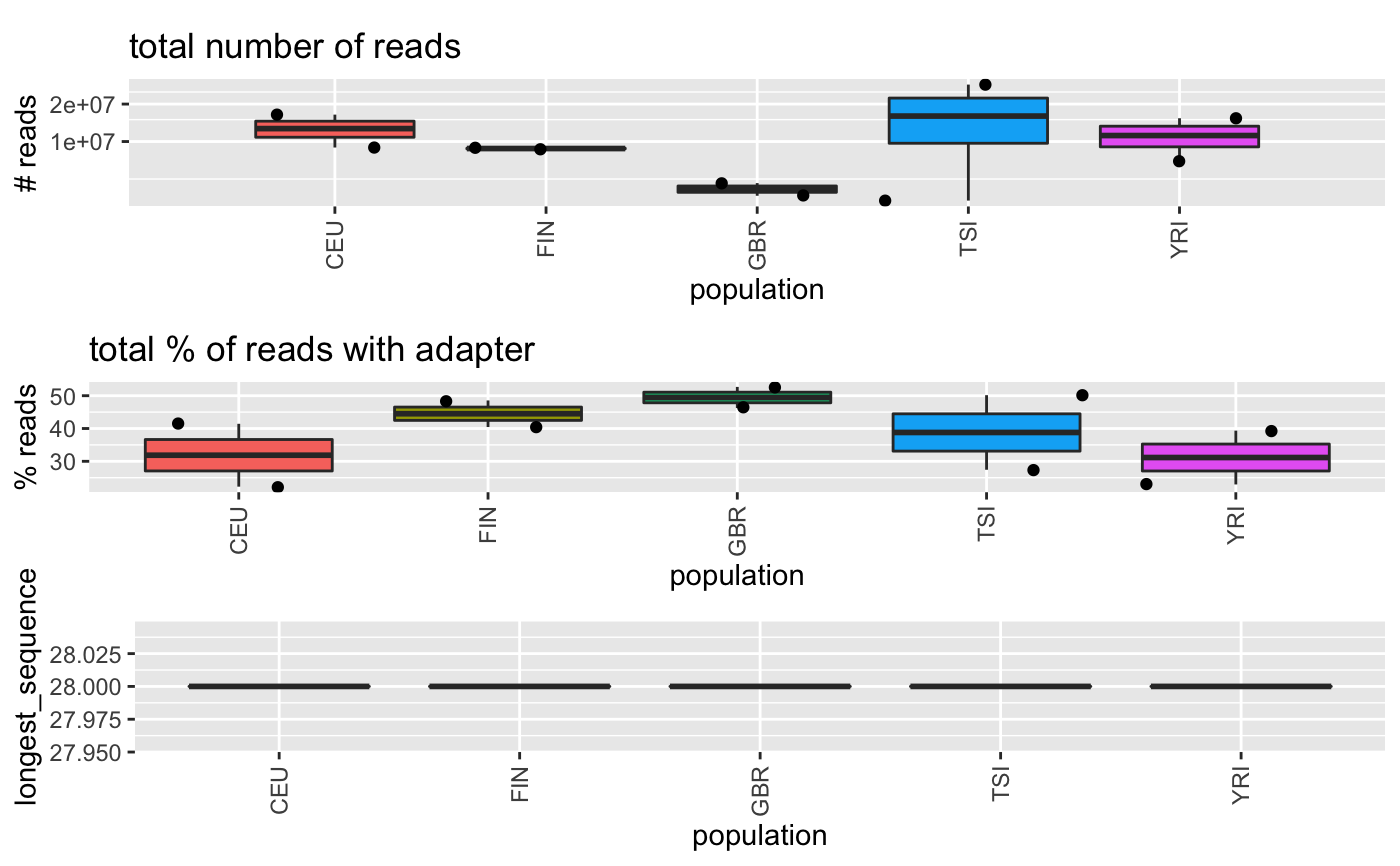
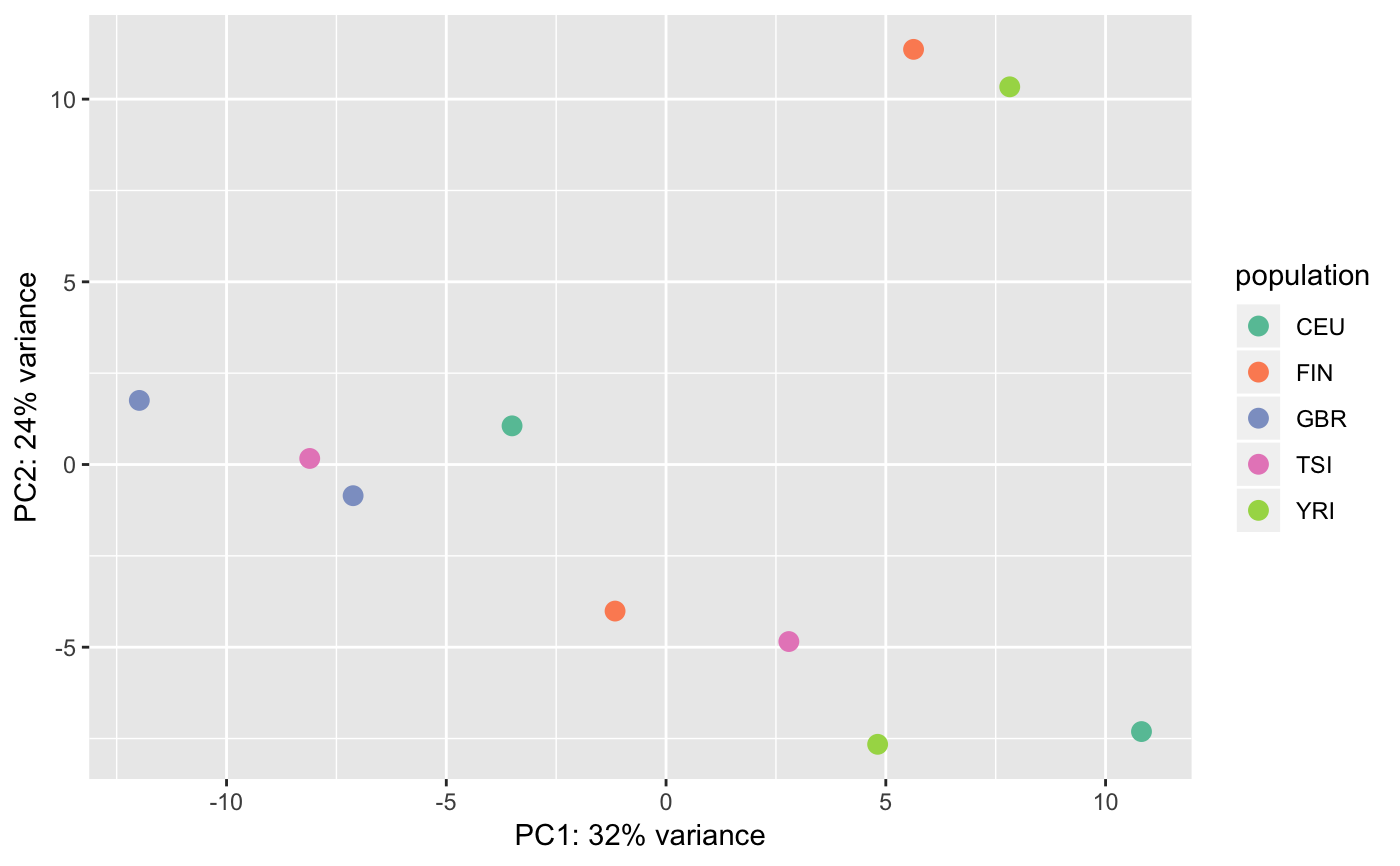
Plot size distribution of small RNA-seq data.
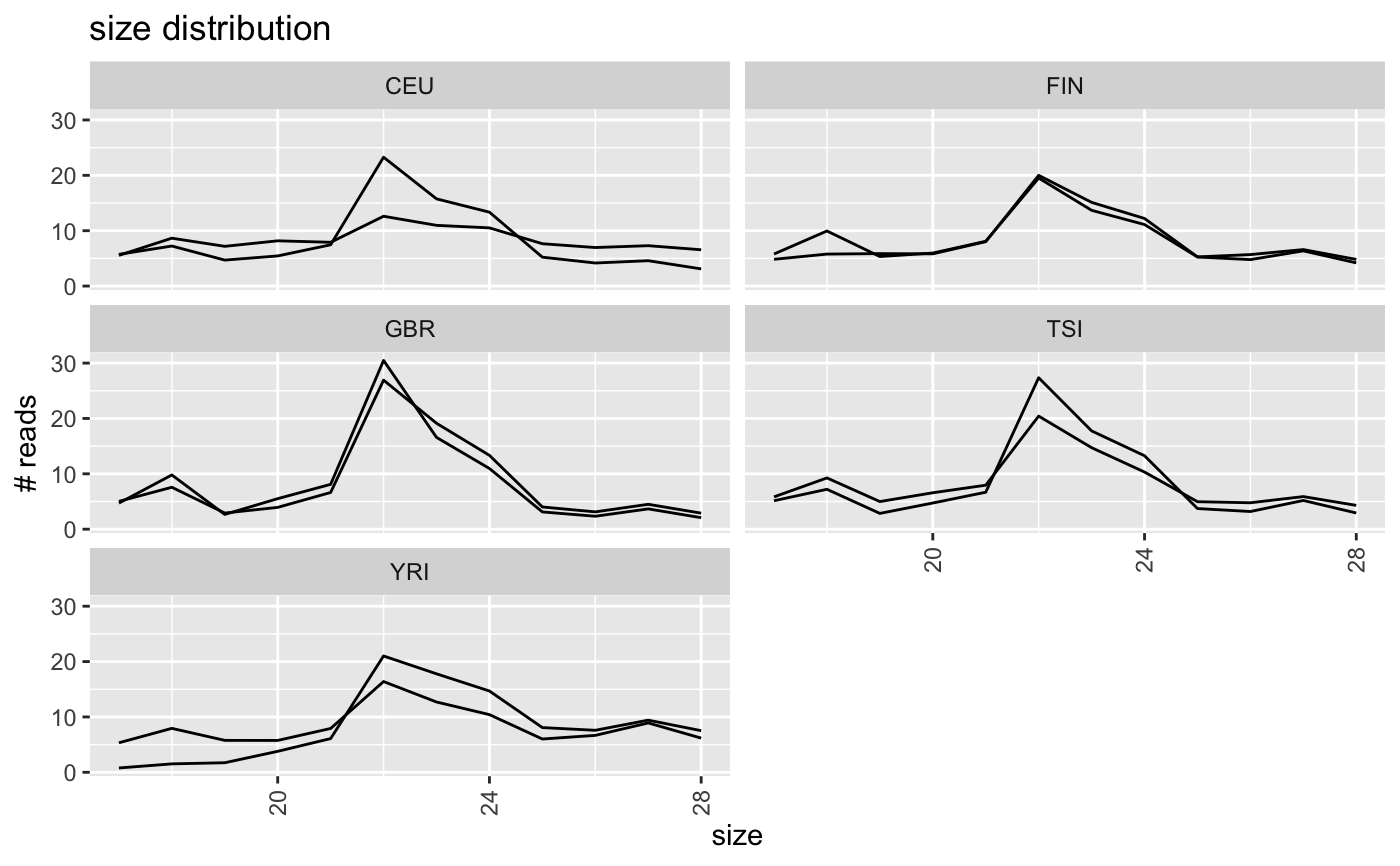
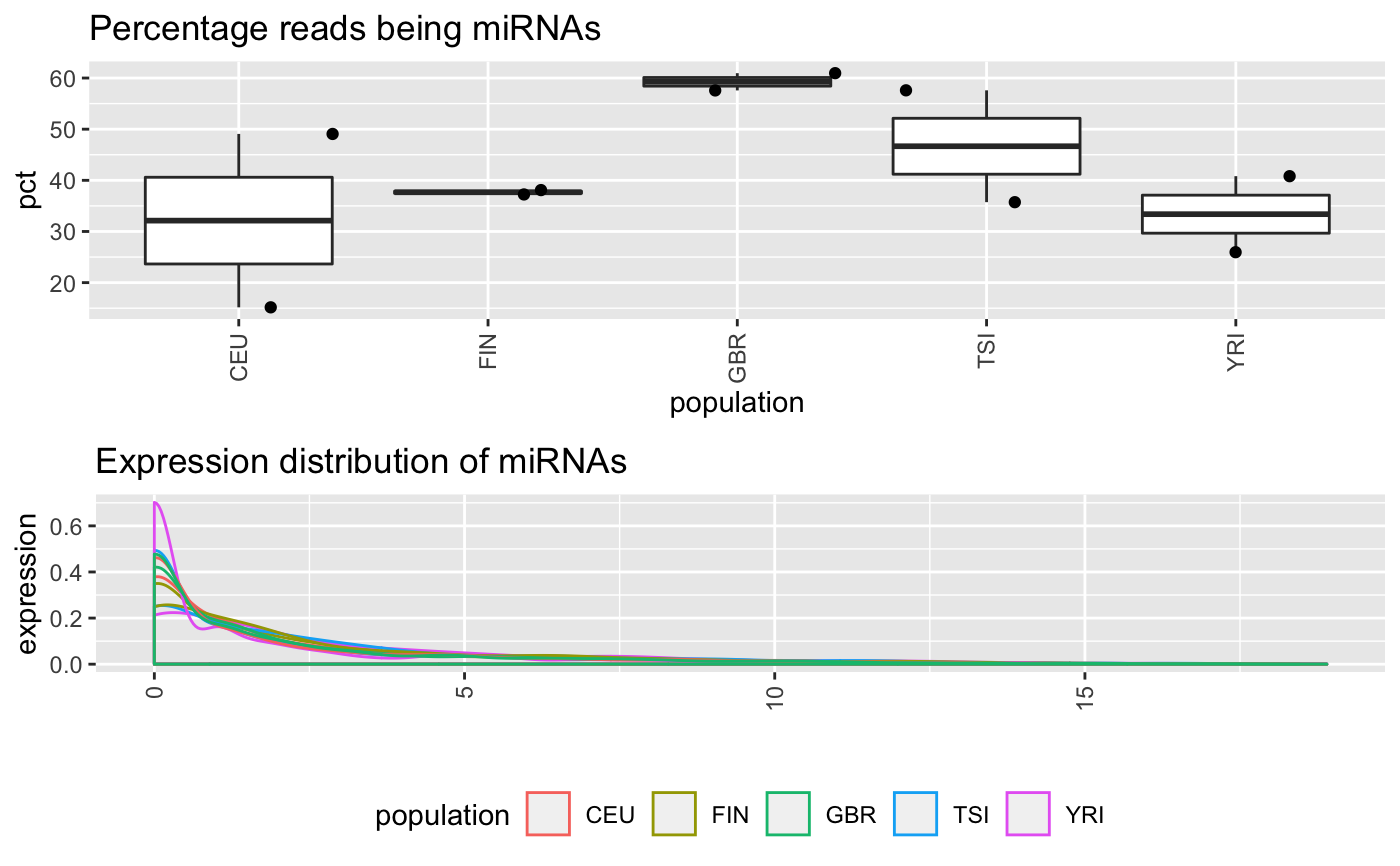
bcbSmallSize(bcb, color = NULL)

bcbSmallSizeDist(bcb, color = NULL, percentage = TRUE)

bcbSmallMicro(bcb, color = NULL)

bcbSmallCluster(bcb, color = NULL)
Arguments
| bcb | |
|---|---|
| color | Column in metadata to use to color the bars. |
| percentage | Whether to plot the percentage or absolute number. |
Value
ggplot.
Examples
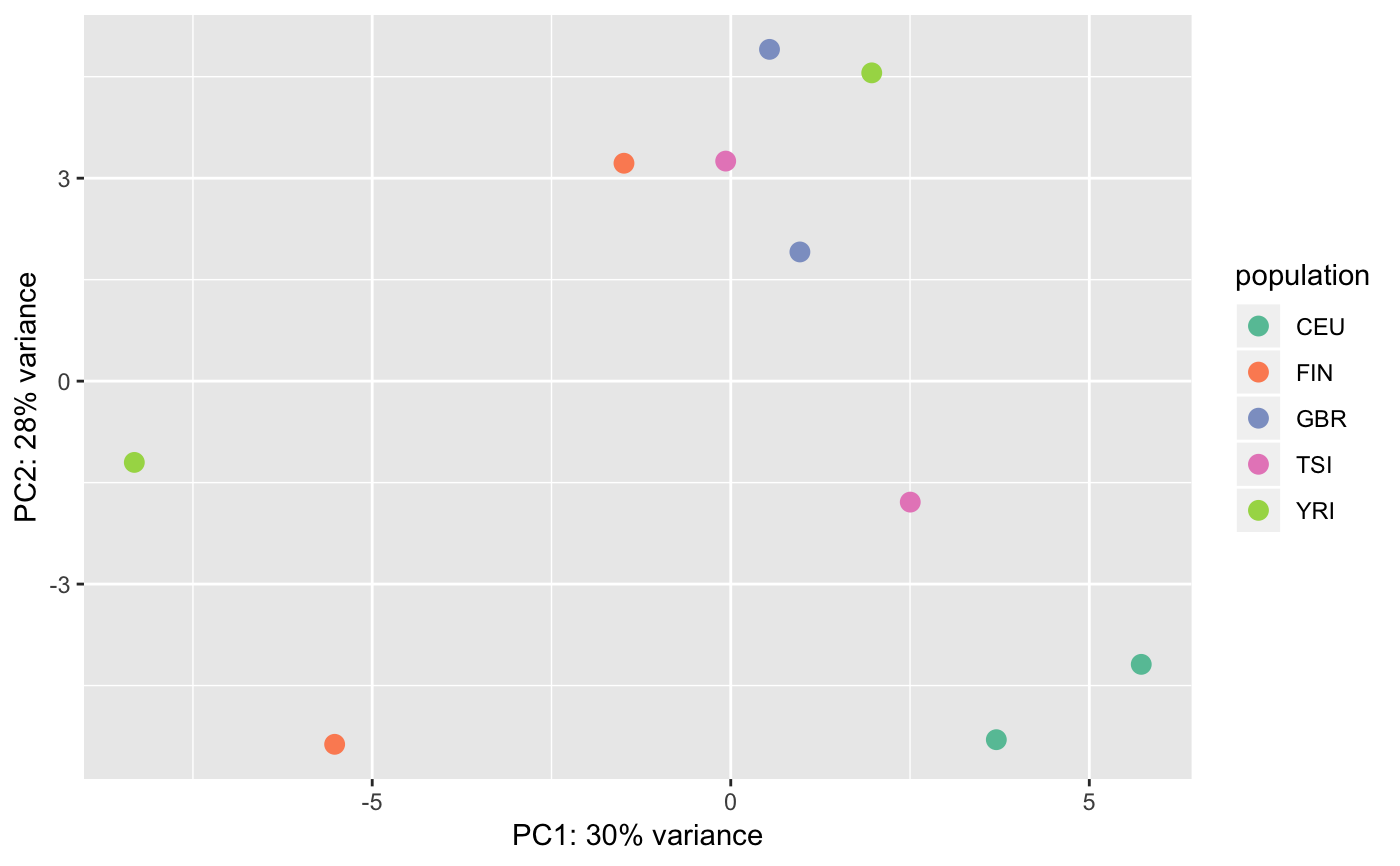
library(DEGreport) data(sbcb) bcbSmallSize(sbcb, color = "population")bcbSmallSizeDist(sbcb, color = "population")bcbSmallMicro(sbcb, color = "population")bcbSmallCluster(sbcb, color = "population")#>#>#>#> Warning: Transformation introduced infinite values in continuous y-axis#> Warning: Removed 1258 rows containing non-finite values (stat_boxplot).data <- bcbSmallPCA(sbcb, minAverage=8) degPCA(data[["counts"]], data[["annotation"]], condition = "population")data <- bcbSmallPCA(sbcb, type = "cluster", minAverage = 8) degPCA(data[["counts"]], data[["annotation"]], condition = "population")