Training Progress Dashboard
Interactive React.js dashboard for personal fitness data visualization and analysis
Overview
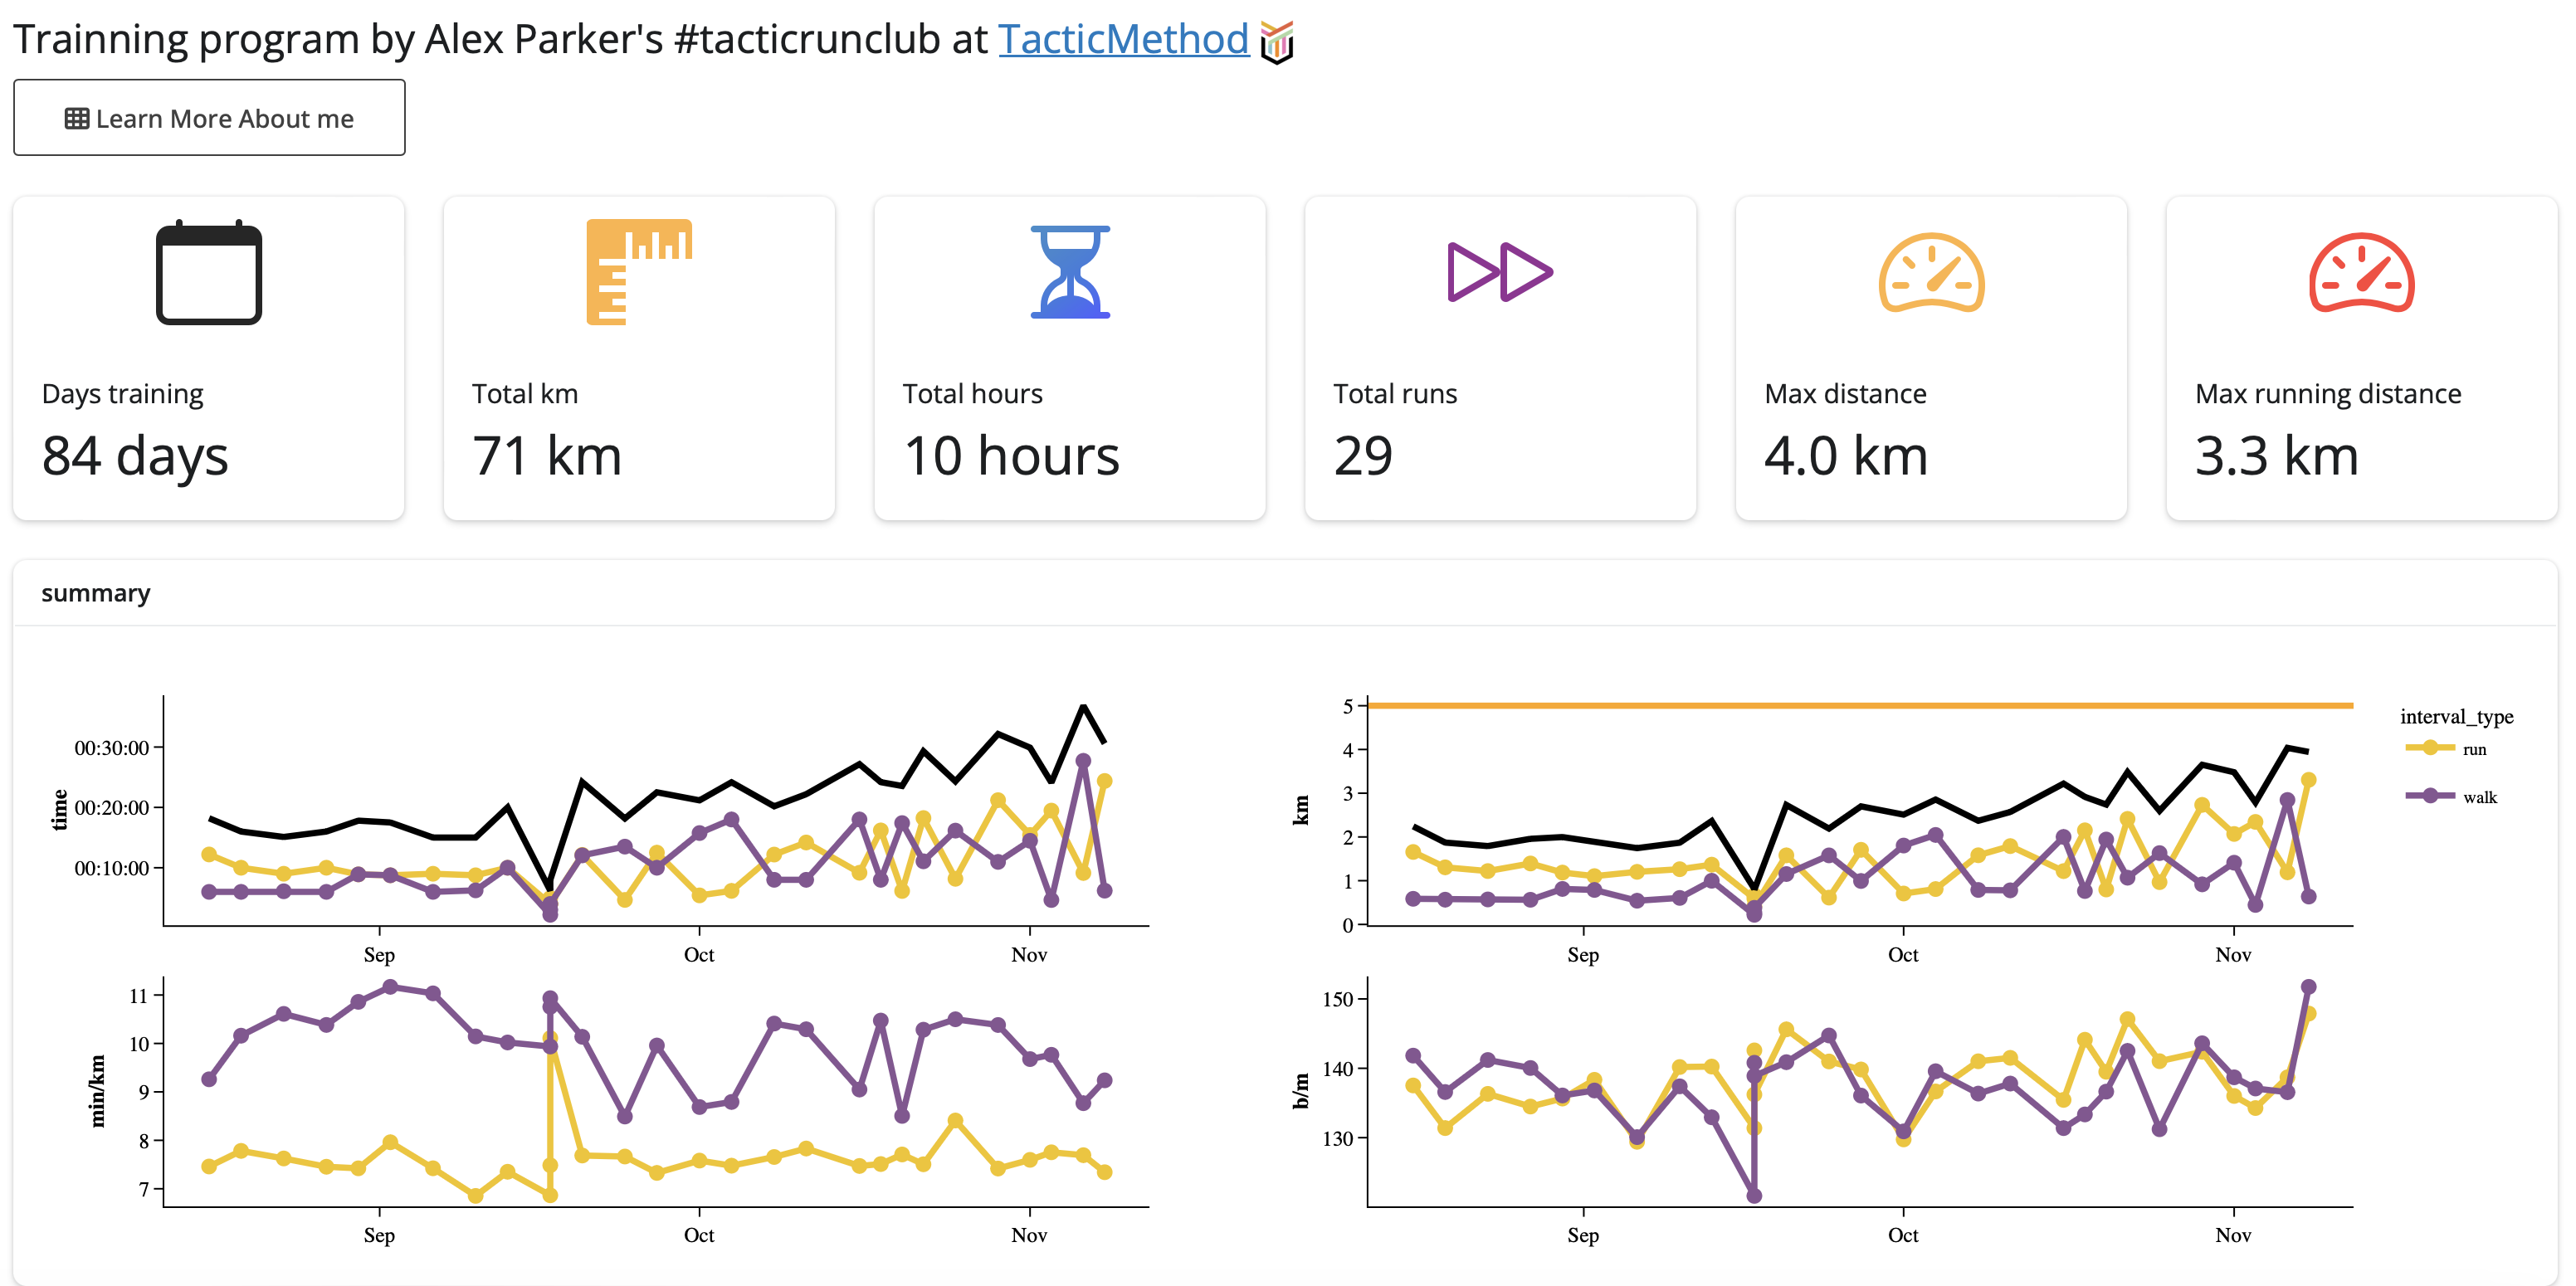
An interactive dashboard built with React.js that visualizes personal training data from Apple Health and Garmin Connect apps. This project demonstrates data visualization best practices and the importance of personal data ownership.
Key Features
- Multi-source Data Integration: Combines data from Apple Health and Garmin Connect
- Interactive Visualizations: Track adaptations in speed, distance, time, and heart rate over time
- Responsive Design: Built with React.js for a smooth user experience
- Data Ownership Focus: Demonstrates how individuals can take control of their health data
Technical Approach
This dashboard emphasizes the importance of:
- Personal data ownership and management
- Standardized data export formats
- Independent data analysis capabilities
- User empowerment over corporate data silos
What It Shows
The dashboard tracks personal training progress, revealing patterns in:
- Speed improvements over time
- Distance progression
- Heart rate adaptation
- Training consistency
Future enhancements will correlate this data with broader health insights to provide a more comprehensive view of fitness and well-being.
Why This Matters
Too often, personal health data is locked in proprietary apps. This project advocates for apps offering data export in standardized formats, individual control over personal data, informed decision-making through accessible analytics, and independence from vendor lock-in.