S&P 500 Historical Dashboard
Interactive dashboard visualizing daily S&P 500 closing prices from 2021 to present, updated weekly
An interactive dashboard built with Astro that visualizes historical S&P 500 index data, displaying daily closing prices from 2021 through the present, updated weekly from Yahoo Finance.
Key Features
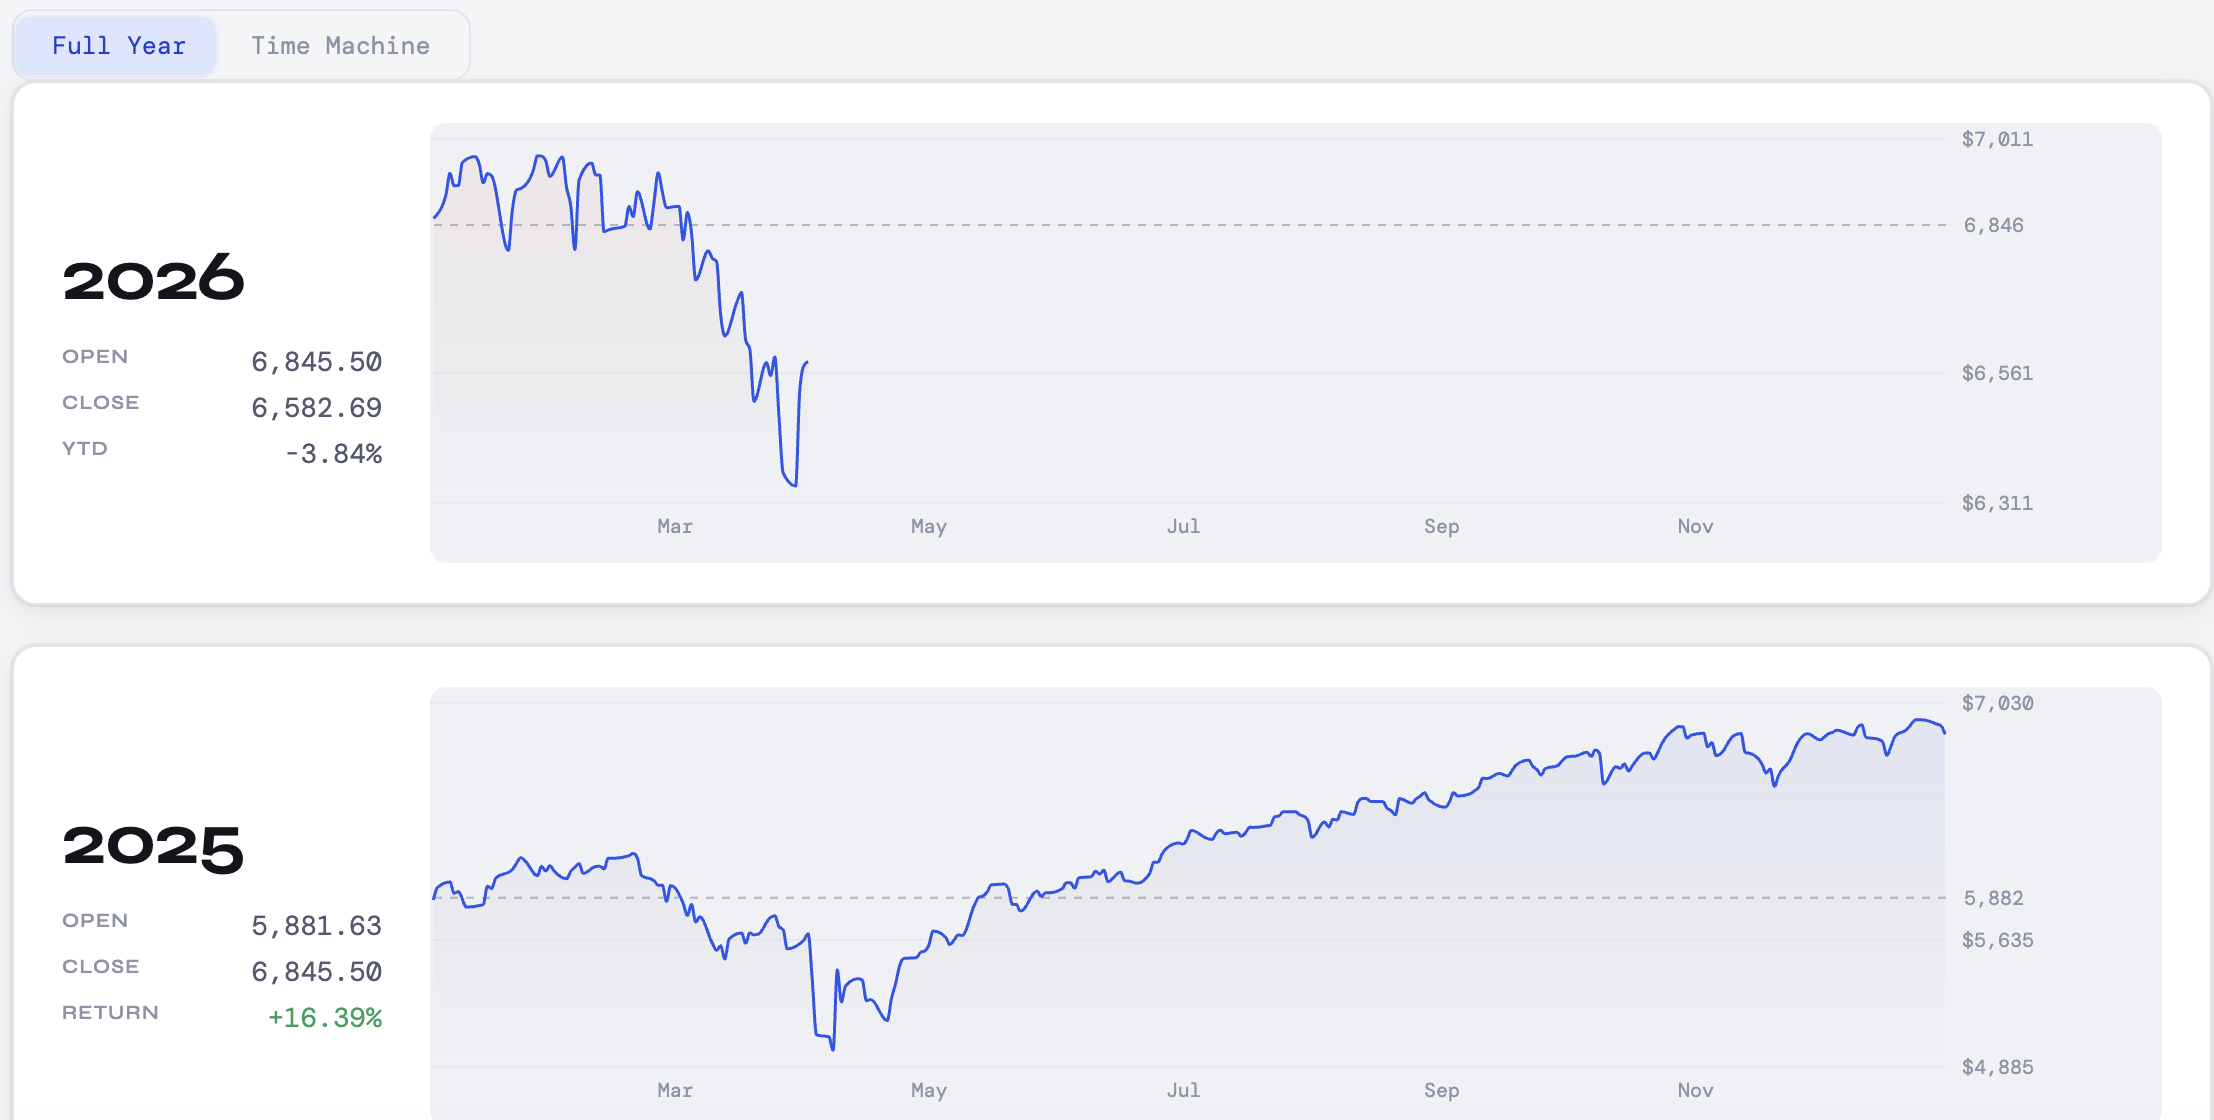
- Year-by-year breakdown: Opening/closing prices and annual returns for each year
- Historical charts: Visual representations of daily price movements
- Performance metrics: Year-to-date returns and percentage gains/losses
- Weekly updates: Data refreshed automatically from Yahoo Finance
Technical Approach
- Built with Astro for fast, static-first rendering
- Data sourced from Yahoo Finance API
- Clean, responsive layout with custom CSS theming