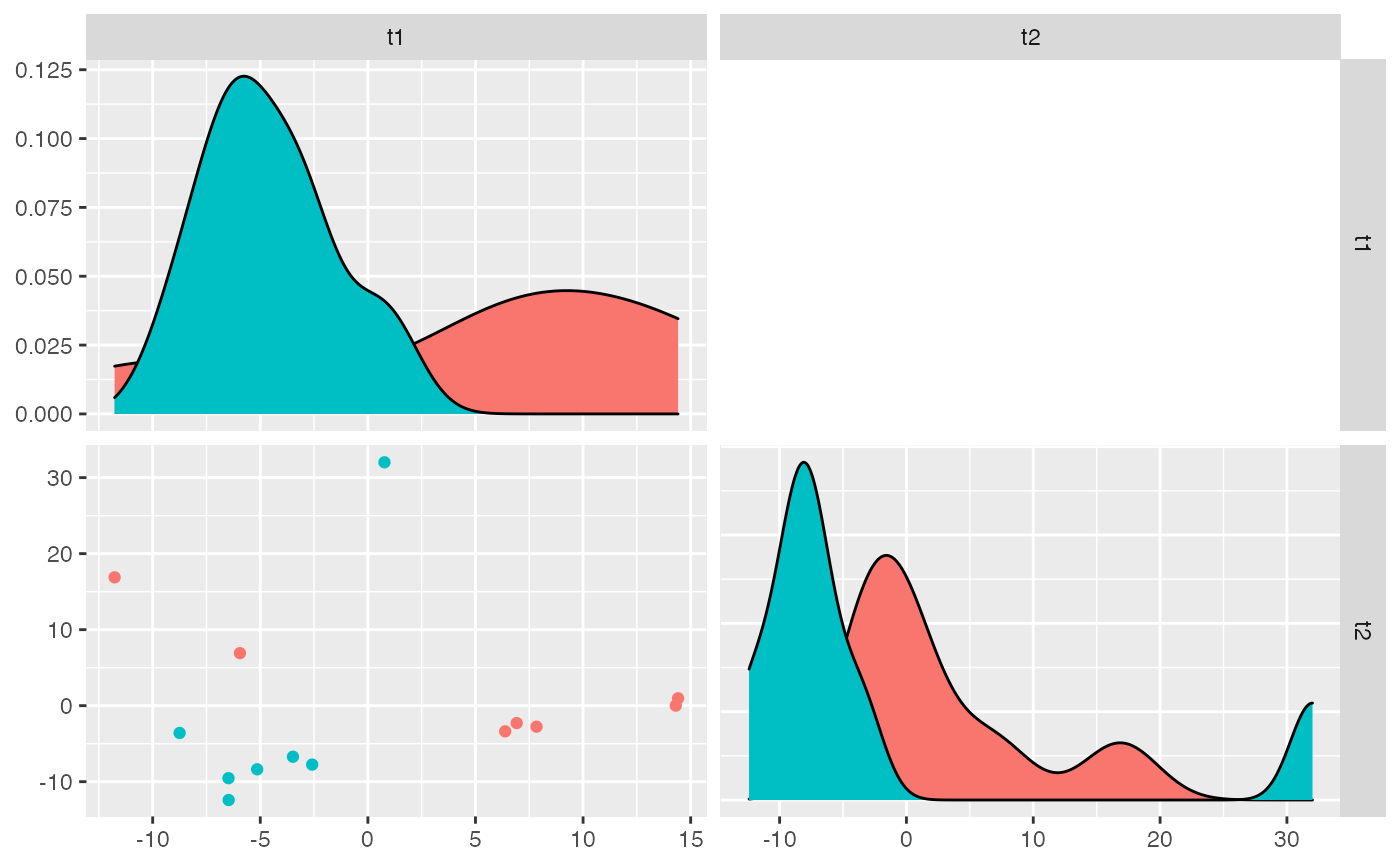
Plot the most significant components that come from isoPLSDA()
analysis together with the density of the samples scores along those components.
isoPLSDAplot(pls, n = 2)
Arguments
| pls | Output from |
|---|---|
| n | Number of components to plot. |
Value
GGally::ggpairs() plot showing the scores
for each sample using isomiRs/miRNAs expression to explain
variation.
base::data.frame object with a first column refering to the sample group, and the following columns refering to the score that each sample has for each component from the PLS-DA analysis.
Details
The function isoPLSDAplot
helps to visualize the results from isoPLSDA().
It will plot the samples using the
significant components (t1, t2, t3 ...) from the PLS-DA analysis and the
samples score distribution along the components.
It uses GGally::ggpairs()
for the plot.
Examples
data(mirData) # Only miRNAs with > 10 reads in all samples. ids <- isoCounts(mirData, minc=10, mins=6) ids <- isoNorm(ids, formula=~condition)#>