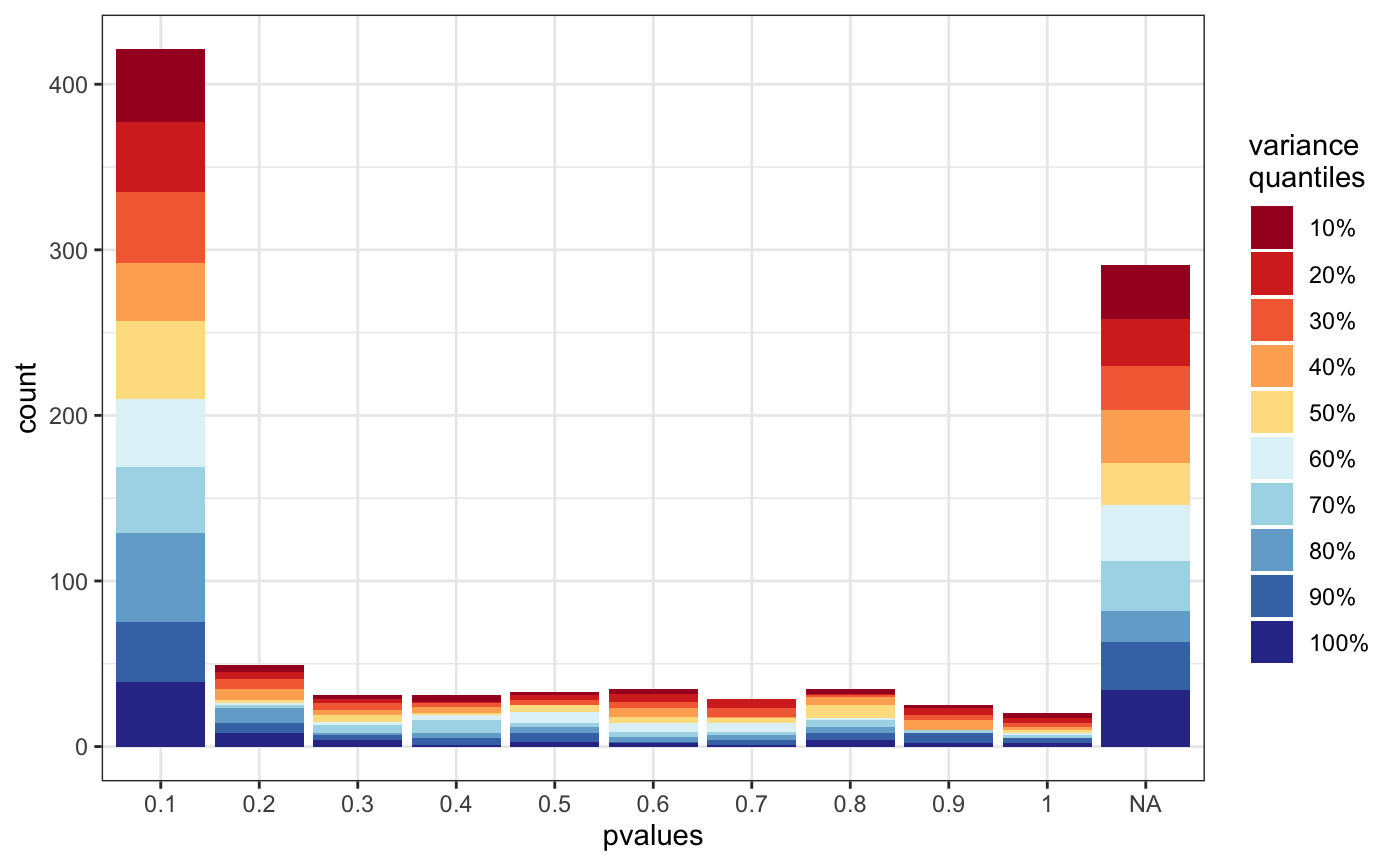
Distribution of pvalues by standard desviation range
degVar.RdThis function pot the p-valyes distribution colored by the quantiles of the standard desviation of count data.
degVar(pvalues, counts)
Arguments
| pvalues | pvalues of DEG analysis |
|---|---|
| counts | Matrix with counts for each samples and each gene. row number should be the same length than pvalues vector. |
Value
ggplot2 object
Examples
data(humanGender) library(DESeq2) idx <- c(1:10, 75:85) dds <- DESeqDataSetFromMatrix(assays(humanGender)[[1]][1:1000, idx], colData(humanGender)[idx,], design=~group) dds <- DESeq(dds)#>#>#>#>#>#>#> #> #>#>#>