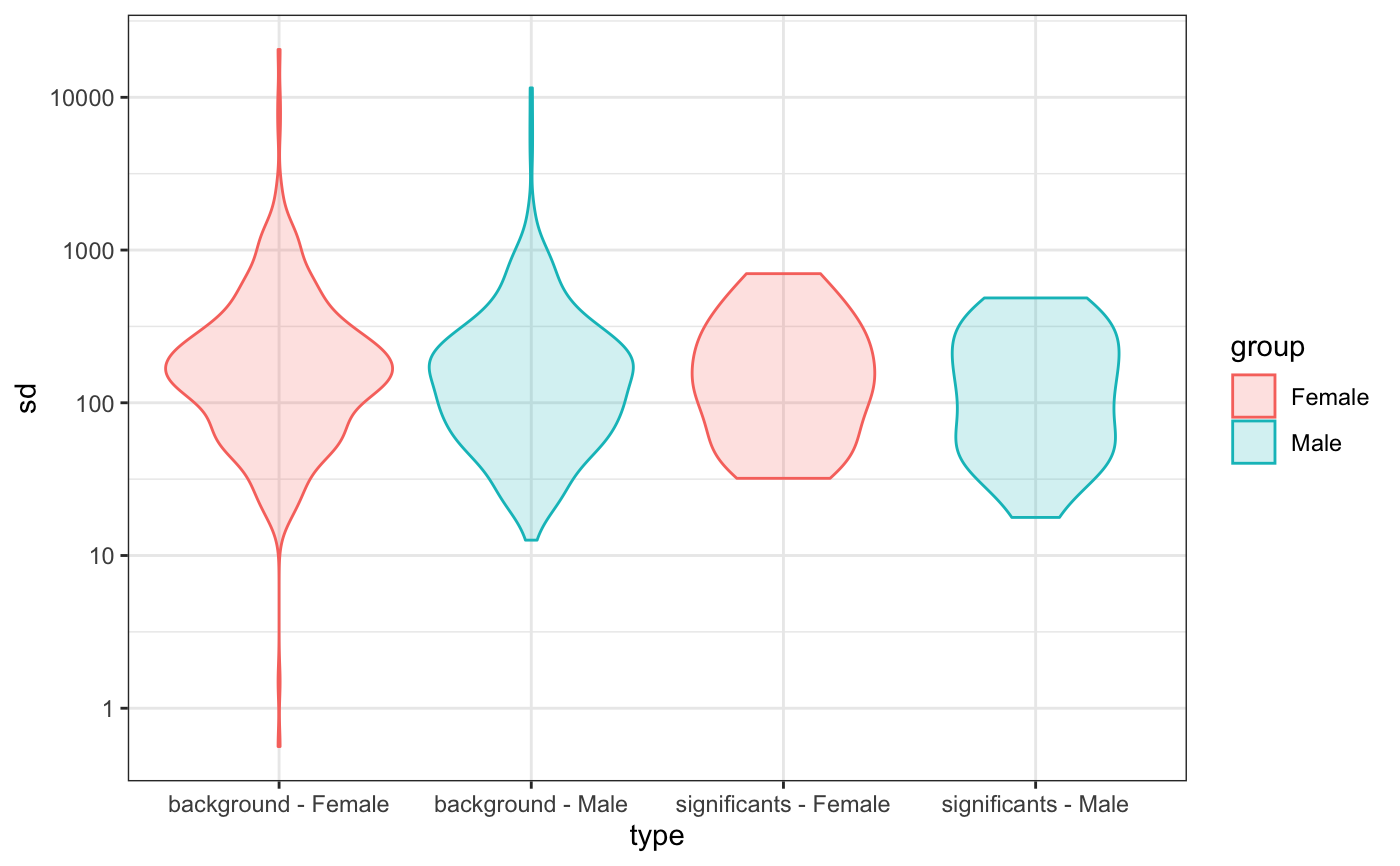
Distribution of the standard desviation of DE genes compared to the background
degVB.RdDistribution of the standard desviation of DE genes compared to the background
degVB(tags, group, counts, pop = 400)
Arguments
| tags | List of genes that are DE. |
|---|---|
| group | Character vector with group name for each sample in the same order than counts column names. |
| counts | matrix with counts for each samples and each gene. Should be same length than pvalues vector. |
| pop | Number of random samples taken for background comparison. |
Value
ggplot2 object
Examples
data(humanGender) library(DESeq2) idx <- c(1:10, 75:85) dds <- DESeqDataSetFromMatrix(assays(humanGender)[[1]][1:1000, idx], colData(humanGender)[idx,], design=~group) dds <- DESeq(dds)#>#>#>#>#>#>#> #> #>#>#>res <- results(dds) degVB(row.names(res)[1:20], colData(dds)[["group"]], counts(dds, normalized = TRUE))