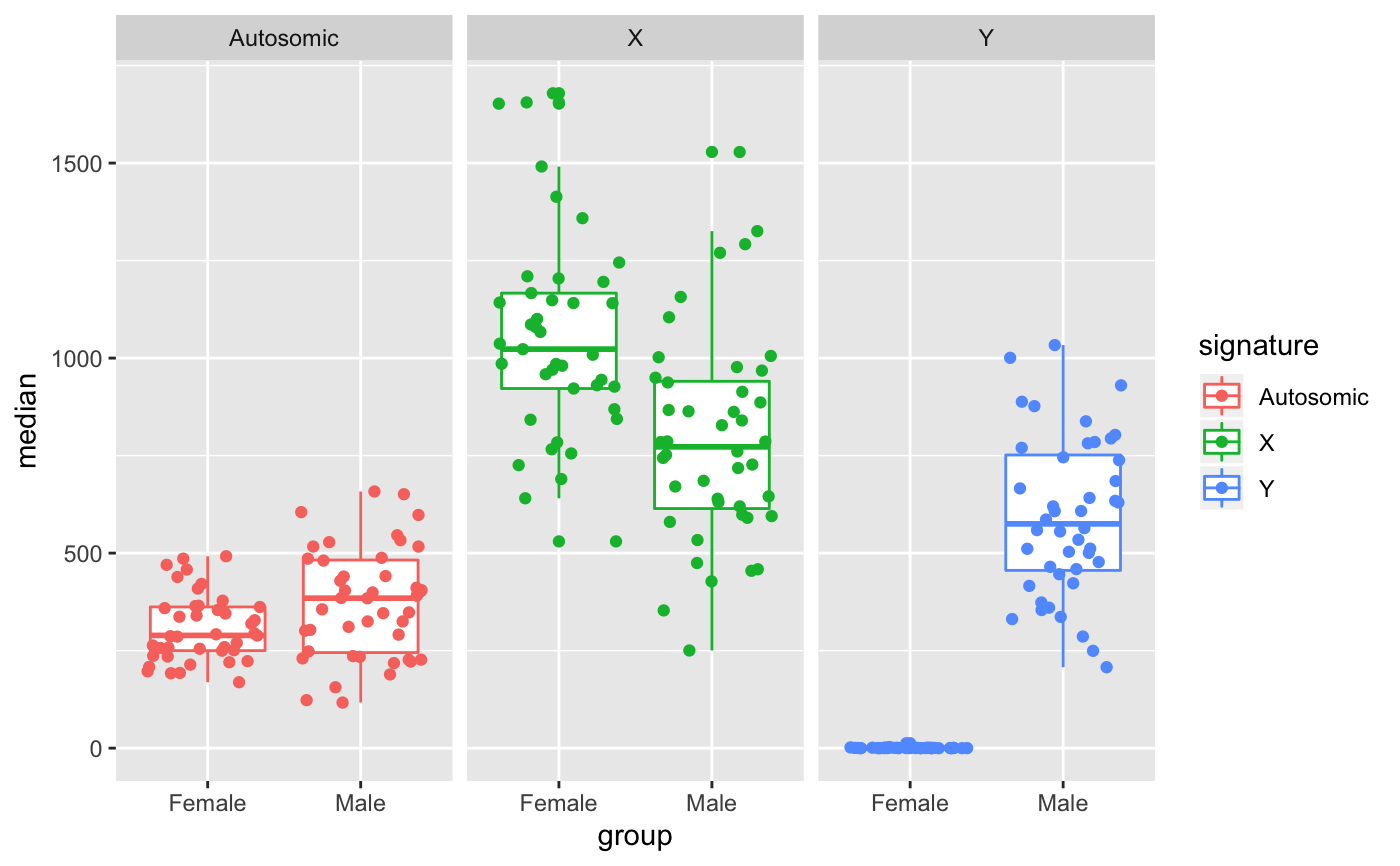
Plot gene signature for each group and signature
degSignature.RdGiven a list of genes beloging to a different classes, like markers, plot for each group, the expression values for all the samples.
degSignature(counts, signature, group = NULL, metadata = NULL,
  slot = 1, scale = FALSE)
Arguments
| counts | expression data. It accepts bcbioRNASeq, DESeqDataSet and SummarizedExperiment. As well, data.frame or matrix is supported, but it requires metadata in that case. |
|---|---|
| signature | data.frame with two columns: a) genes that match row.names of counts, b) label to classify the gene inside a group. Normally, cell tissue name. |
| group | character in metadata used to split data into different groups. |
| metadata | data frame with sample information. Rownames
should match |
| slot | slotName in the case of SummarizedExperiment objects. |
| scale | Whether to scale or not the expression. |
Value
ggplot plot.
Examples
#>