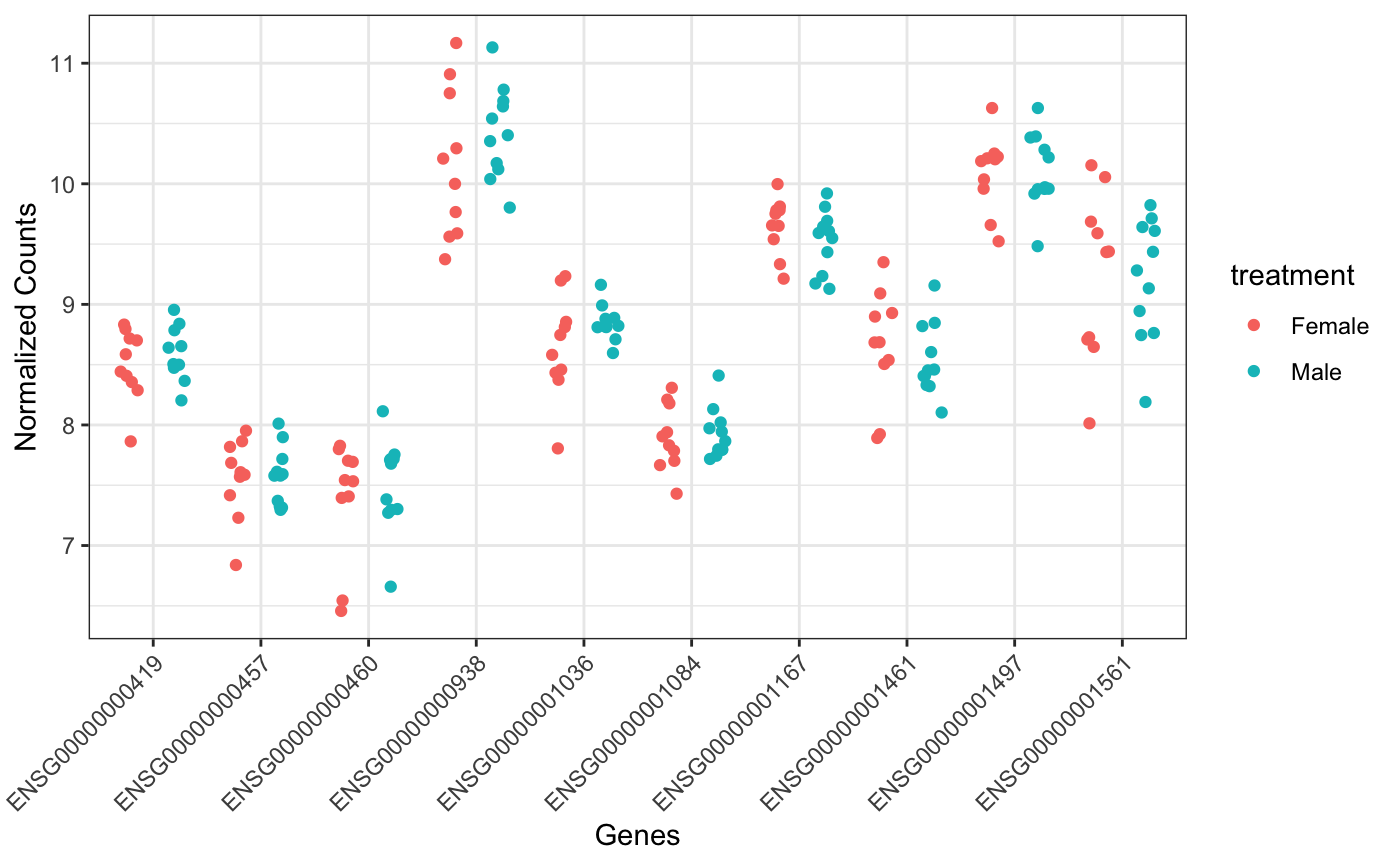
Plot selected genes on a wide format
degPlotWide.RdPlot selected genes on a wide format
degPlotWide(counts, genes, group, metadata = NULL, batch = NULL)
Arguments
| counts | DESeq2::DESeqDataSet object or expression matrix |
|---|---|
| genes | character genes to plot. |
| group | character, colname in colData to color points and add different lines for each level |
| metadata | data.frame, information for each sample. Not needed if DESeq2::DESeqDataSet given as counts. |
| batch | character, colname in colData to shape points, normally used by batch effect visualization |
Value
ggplot showing the expresison of the genes on the x axis
Examples
data(humanGender) library(DESeq2) idx <- c(1:10, 75:85) dse <- DESeqDataSetFromMatrix(assays(humanGender)[[1]][1:1000, idx], colData(humanGender)[idx,], design=~group) dse <- DESeq(dse)#>#>#>#>#>#>#> #> #>#>#>