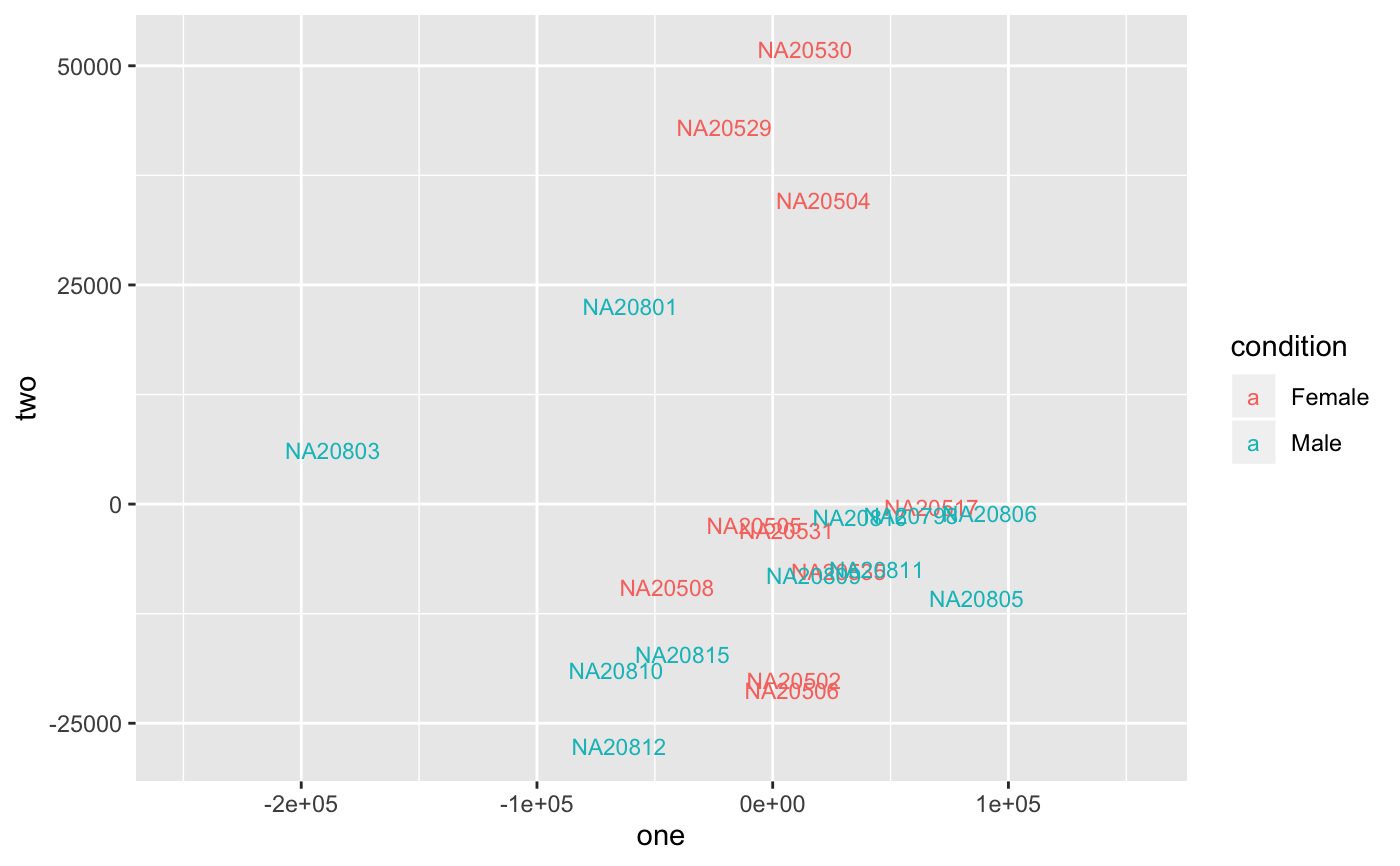
Plot MDS from normalized count data
degMDS.RdUses cmdscale to get multidimensional scaling of data matrix, and plot the samples with ggplot2.
degMDS(counts, condition = NULL, k = 2, d = "euclidian", xi = 1,
  yi = 2)
Arguments
| counts | matrix samples in columns, features in rows |
|---|---|
| condition | vector define groups of samples in counts. It has to be same order than the count matrix for columns. |
| k | integer number of dimensions to get |
| d | type of distance to use, c("euclidian", "cor"). |
| xi | number of component to plot in x-axis |
| yi | number of component to plot in y-axis |
Value
ggplot2 object
Examples
data(humanGender)
library(DESeq2)
idx <- c(1:10, 75:85)
dse <- DESeqDataSetFromMatrix(assays(humanGender)[[1]][1:1000, idx],
  colData(humanGender)[idx,], design=~group)
degMDS(counts(dse), condition = colData(dse)[["group"]])