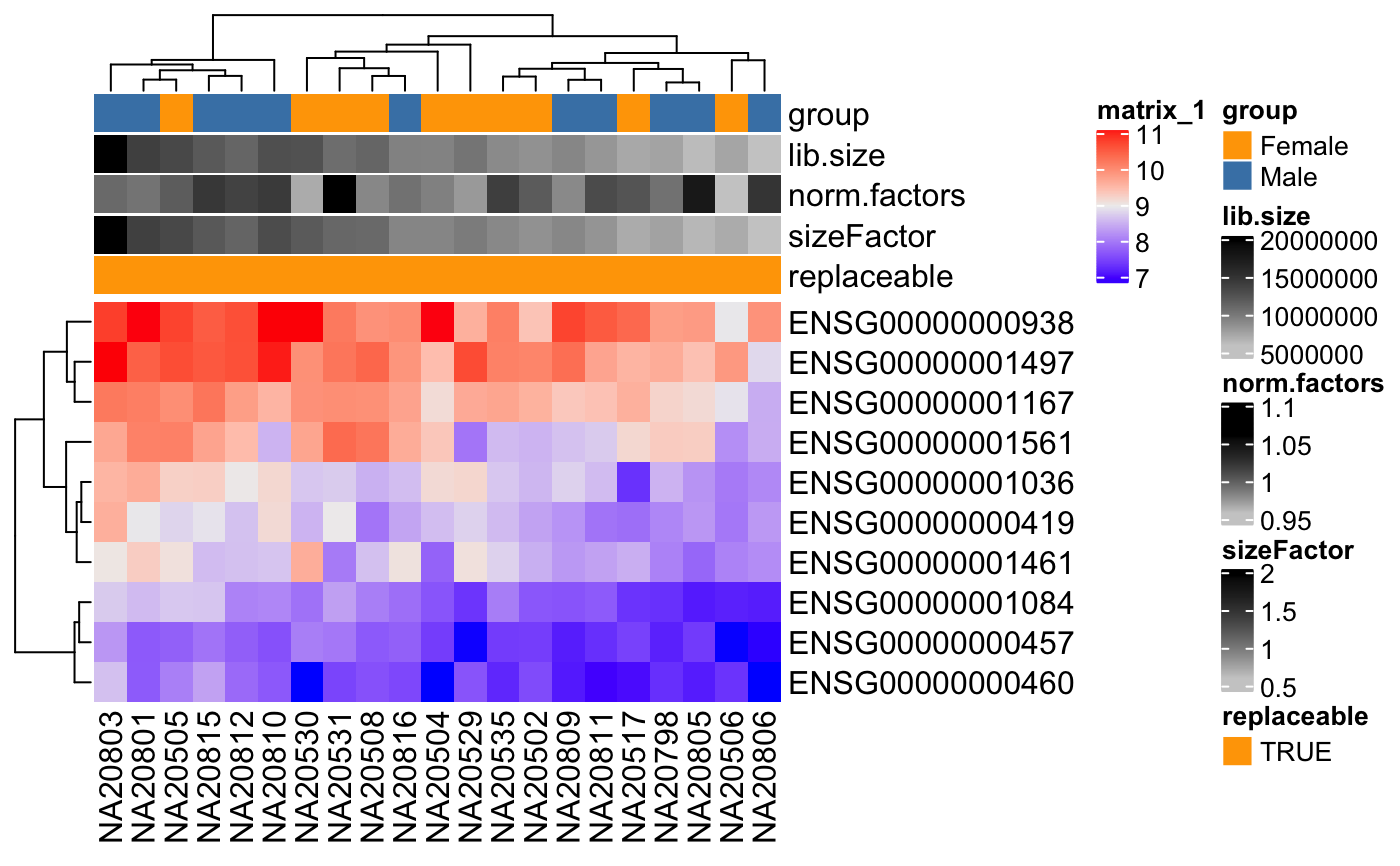
Make nice colors for metadata
degColors.RdThe function will take a metadata table and use Set2 palette when number of levels is > 3 or a set or orange/blue colors other wise.
degColors(ann, col_fun = FALSE, con_values = c("grey80", "black"),
  cat_values = c("orange", "steelblue"), palette = "Set2")
Arguments
| ann | Data.frame with metadata information. Each column will be used to generate a palette suitable for the values in there. |
|---|---|
| col_fun | Whether to return a function for continuous variables
(compatible with [pheatmap::pheatmap())]: R:pheatmap::pheatmap()) |
| con_values | Color to be used for continuous variables. |
| cat_values | Color to be used for 2-levels categorical variables. |
| palette | Palette to use from |
Examples
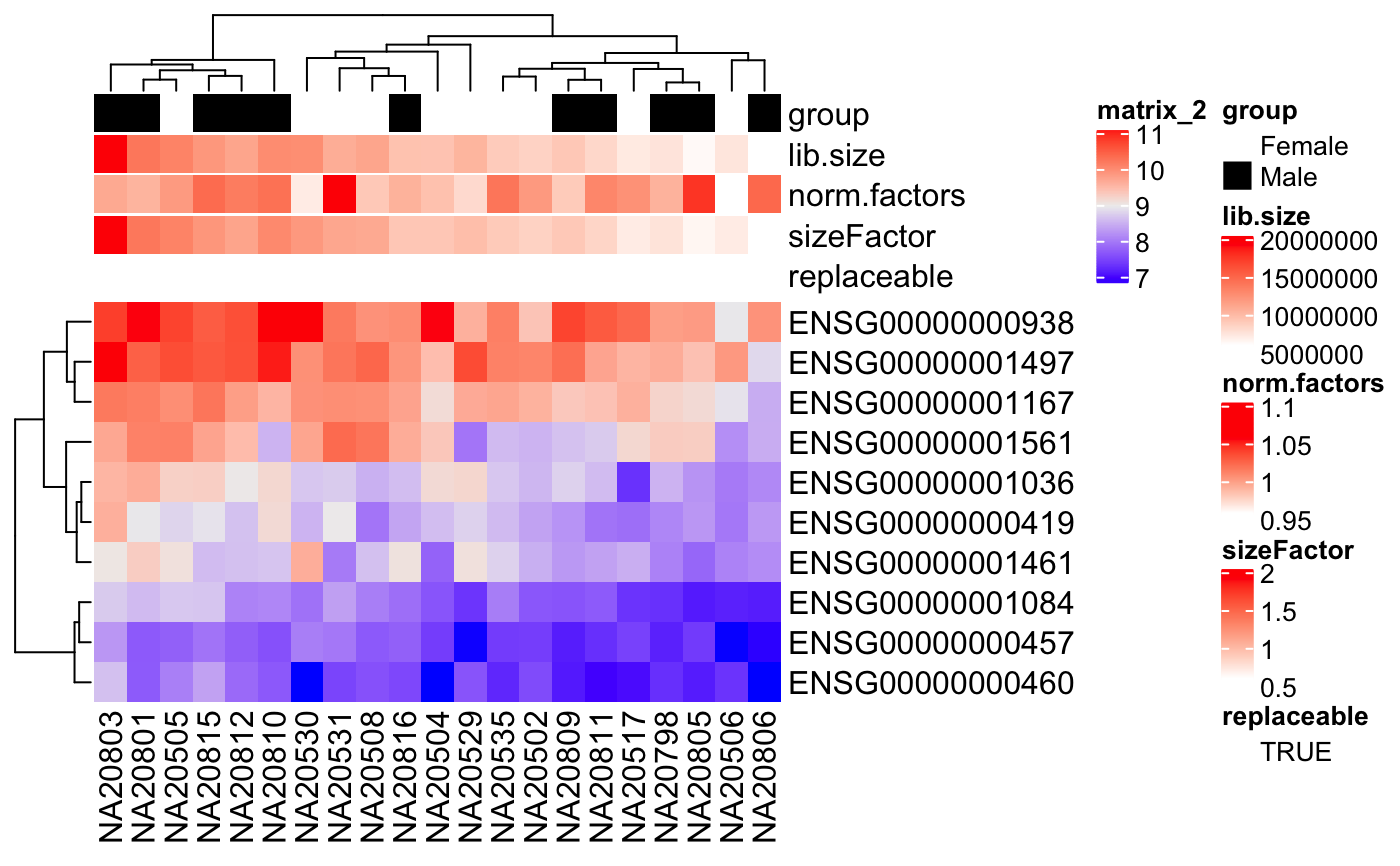
#>#> #> #> #> #> #> #> #> #> #>idx <- c(1:10, 75:85) dse <- DESeqDataSetFromMatrix(assays(humanGender)[[1]][1:10, idx], colData(humanGender)[idx,], design=~group) th <- HeatmapAnnotation(df = colData(dse), col = degColors(colData(dse), TRUE)) Heatmap(log2(counts(dse)+0.5), top_annotation = th)custom <- degColors(colData(dse), TRUE, con_values = c("white", "red"), cat_values = c("white", "black"), palette = "Set1") th <- HeatmapAnnotation(df = colData(dse), col = custom) Heatmap(log2(counts(dse)+0.5), top_annotation = th)