This function creates a heatmap with the top N
isomiRs/miRNAs. It uses the matrix under counts(ids)
to get the top expressed isomiRs/miRNAs using the average
expression value
and plot a heatmap with the raw counts for each sample.
isoTop(ids, top = 20)
Arguments
| ids | Object of class IsomirDataSeq. |
|---|---|
| top | Number of isomiRs/miRNAs used. |
Value
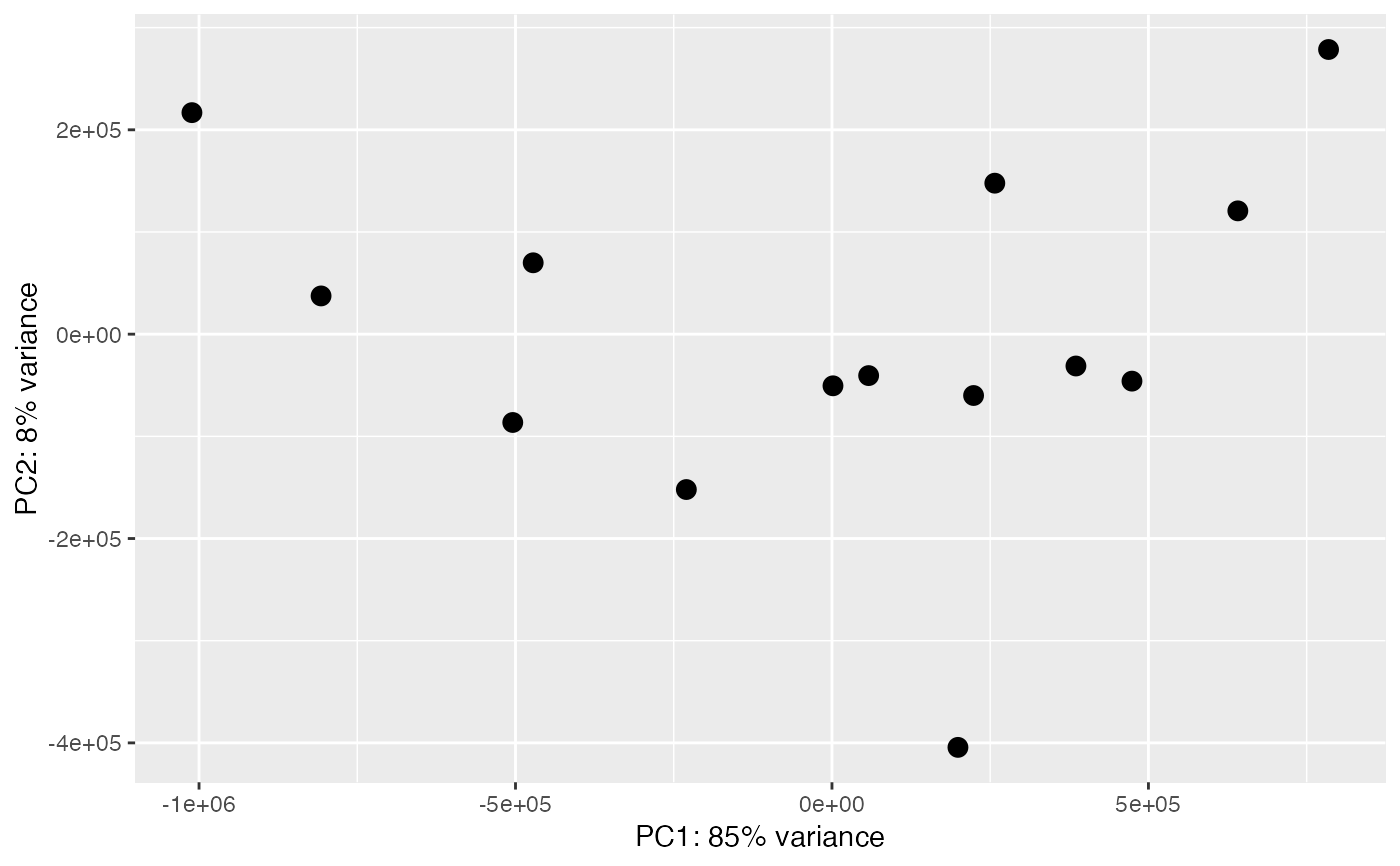
PCA of the top expressed miRNAs